This is a portion of the full case study presented at Reliable Plant 2016 by Tacoma Zach, CEO Uberlytics and Thomas Kurtz, Director of Workforce Solutions, Noria Corporation.
In 2014 Uberlytics was contracted by IMG Rebel to assist with a massive performance improvement initiative at the City of Tulsa water and wastewater utility, with the aim of becoming a national leader in performance and asset management.
In 2012, the board of the Tulsa Metropolitan Utility Authority (TMUA) voted unanimously to launch an aggressive four-year performance initiative, instead of choosing to privatize its water and sewer system via a long-term lease. The new initiative would touch every aspect of the water and sewer utility’s management, operations and capital investment program. Its goal was to make Tulsa’s utility competitive with the very best private operators in the country and in the process reduce the long-term increases in water and sewer rates by at least 20 percent.
Uberlytics was brought in by Infrastructure Management Group, Inc. (“IMG”, now IMG Rebel LLC), the firm leading the utility reformation, which would include an aggressive asset management improvement plan. Uberlytics would help lay the foundation for successful asset management through asset register and hierarchy consulting.
To start with, TMUA needed to implement a new CMMS system, since they had no common platform between facilities. Since the new CCMS system was going to need a fresh import of the asset register it presented a great opportunity to clean up and augment data that was to be used. This represented a significant opportunity since the current state of the data was not going to take advantage of the new CMMS. The overall situation could be described as follows:
- State of data: fragmented content, dissimilar platforms, disjointed nomenclature, no standards, incomplete
- Challenge: 10 facilities: no common asset type codes, nothing related to Failure modes, 18000 existing assets (30% complete)
- Immediate Mission: create useful asset hierarchy that was “functional system” based, comprehensive, cohesive, with asset type codes reflective of Failure Modes.
To look at it with the end goal in mind, working backwards, the long term goal was to create a mature asset management program based on Failure Mode Management. To get there the intermediate goals are to perform a functional system criticality analysis, which drives the RCM focus and the condition assessment focus, which then drives the condition monitoring and failure mode management program. This is illustrated in the Asset Management Pyramid that connects the dots from asset register right on up through to maintaining Level of Service (LOS) or production at optimal cost, the ultimate end goal.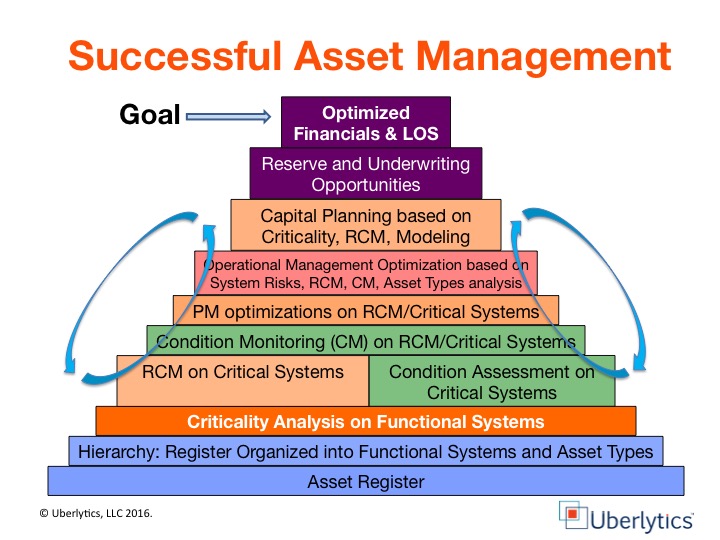
The short-term goal was then to focus on the hierarchy development and CMMS implementation to facilitate a drive to a mature AM program. The aim here is to have better work order management and cost allocation.
As stated in current state the quality of the asset data was poor:
- no set asset nomenclature
- no set asset descriptions on location or function
- high degree of variability on asset attribute data
- three different software platforms
- 25 to 60% incomplete
- Variability in asset definition
The immediate challenge was to develop a ‘functional system’ based hierarchy, thereby putting a common structure around the assets for them to fit into.
This involved development of a common asset type nomenclature relevant to 9 systems, including the horizontal assets in the collection and distribution system.
After the first plant asset register was organized into functional systems, Tulsa staff expressed that they wanted a more comprehensive asset register than they currently had, as complete as practical for inclusion into the new database.
We had some indication as to how fragmented the data was based on discussions with staff and their engineering consultant and the state of the Southside plant data. But since we had not yet reviewed the other plant data in full we were at a disadvantage. We reached out to Noria to be the boots on the ground to capture the unrecorded asset list, and do so with asset type codes and other important database information captured on the spot. Noria had the kind of experienced staff and a unique capture tool to facilitate just this need.
Noria concluded the data collection project on September 11 and collected over 24,000 assets in approximately 1,000 hours. That is an average of one asset every 2.5 minutes … collected, photographed, processed and delivered. This portion of the project was successful because of the right mix of time, place, tools … and the right people thinking outside of the box, working with focus and dedication to get the job done accurately, on time and on budget.
Asset Register Integration & Hierarchy Development
Once the asset register had been fleshed out with the field captured data the data was then meshed with the pre-existing digital data from Tulsa. On average the register count for each plant increased 200%, ranging from 50 to 400%,
The pre-existing Tulsa data required considerable scrubbing on several fronts as previously indicated to make it useful, eliminate duplication, identify exactly which assets belonged to which systems, and to allocate asset types reflective of real failure modes. The approach to grouping assets into systems and determination of asset types was made with the input of Tulsa staff.
Once Asset types and nomenclature of pre-existing data were deciphered, the data was meshed with the field-collected data and organized into the functional system hierarchy.
Functional System Hierarchy
One of the key reasons for this whole initiative was to organize the hierarchy by functional system. The main reason for this type of organization over other types, like a geographic organization, is to better facilitate and determine which systems, and hence assets, are critical to the overall aims of the organization. Assets in and of themselves provide limited benefits and functions to a facility. However grouped into systems that deliver a unique and defined function, or service, to a facility provides several benefits:
- It facilitates the most efficient means of identifying critical systems to a facility.
- Permits the analysis of 100% of an asset register.
- Focuses the analysis on mission critical assets.
- Focuses all subsequent RCM and condition assessment analysis.
Key to achieving this is proper organization of actual basic functional systems. Only critical systems have critical assets. If the failure of a system has a big impact on facility goals, then some assets inside that system are critical. If an entire functional system can disappear and it has little impact on overall facility goals, then the assets inside that system are not critical.
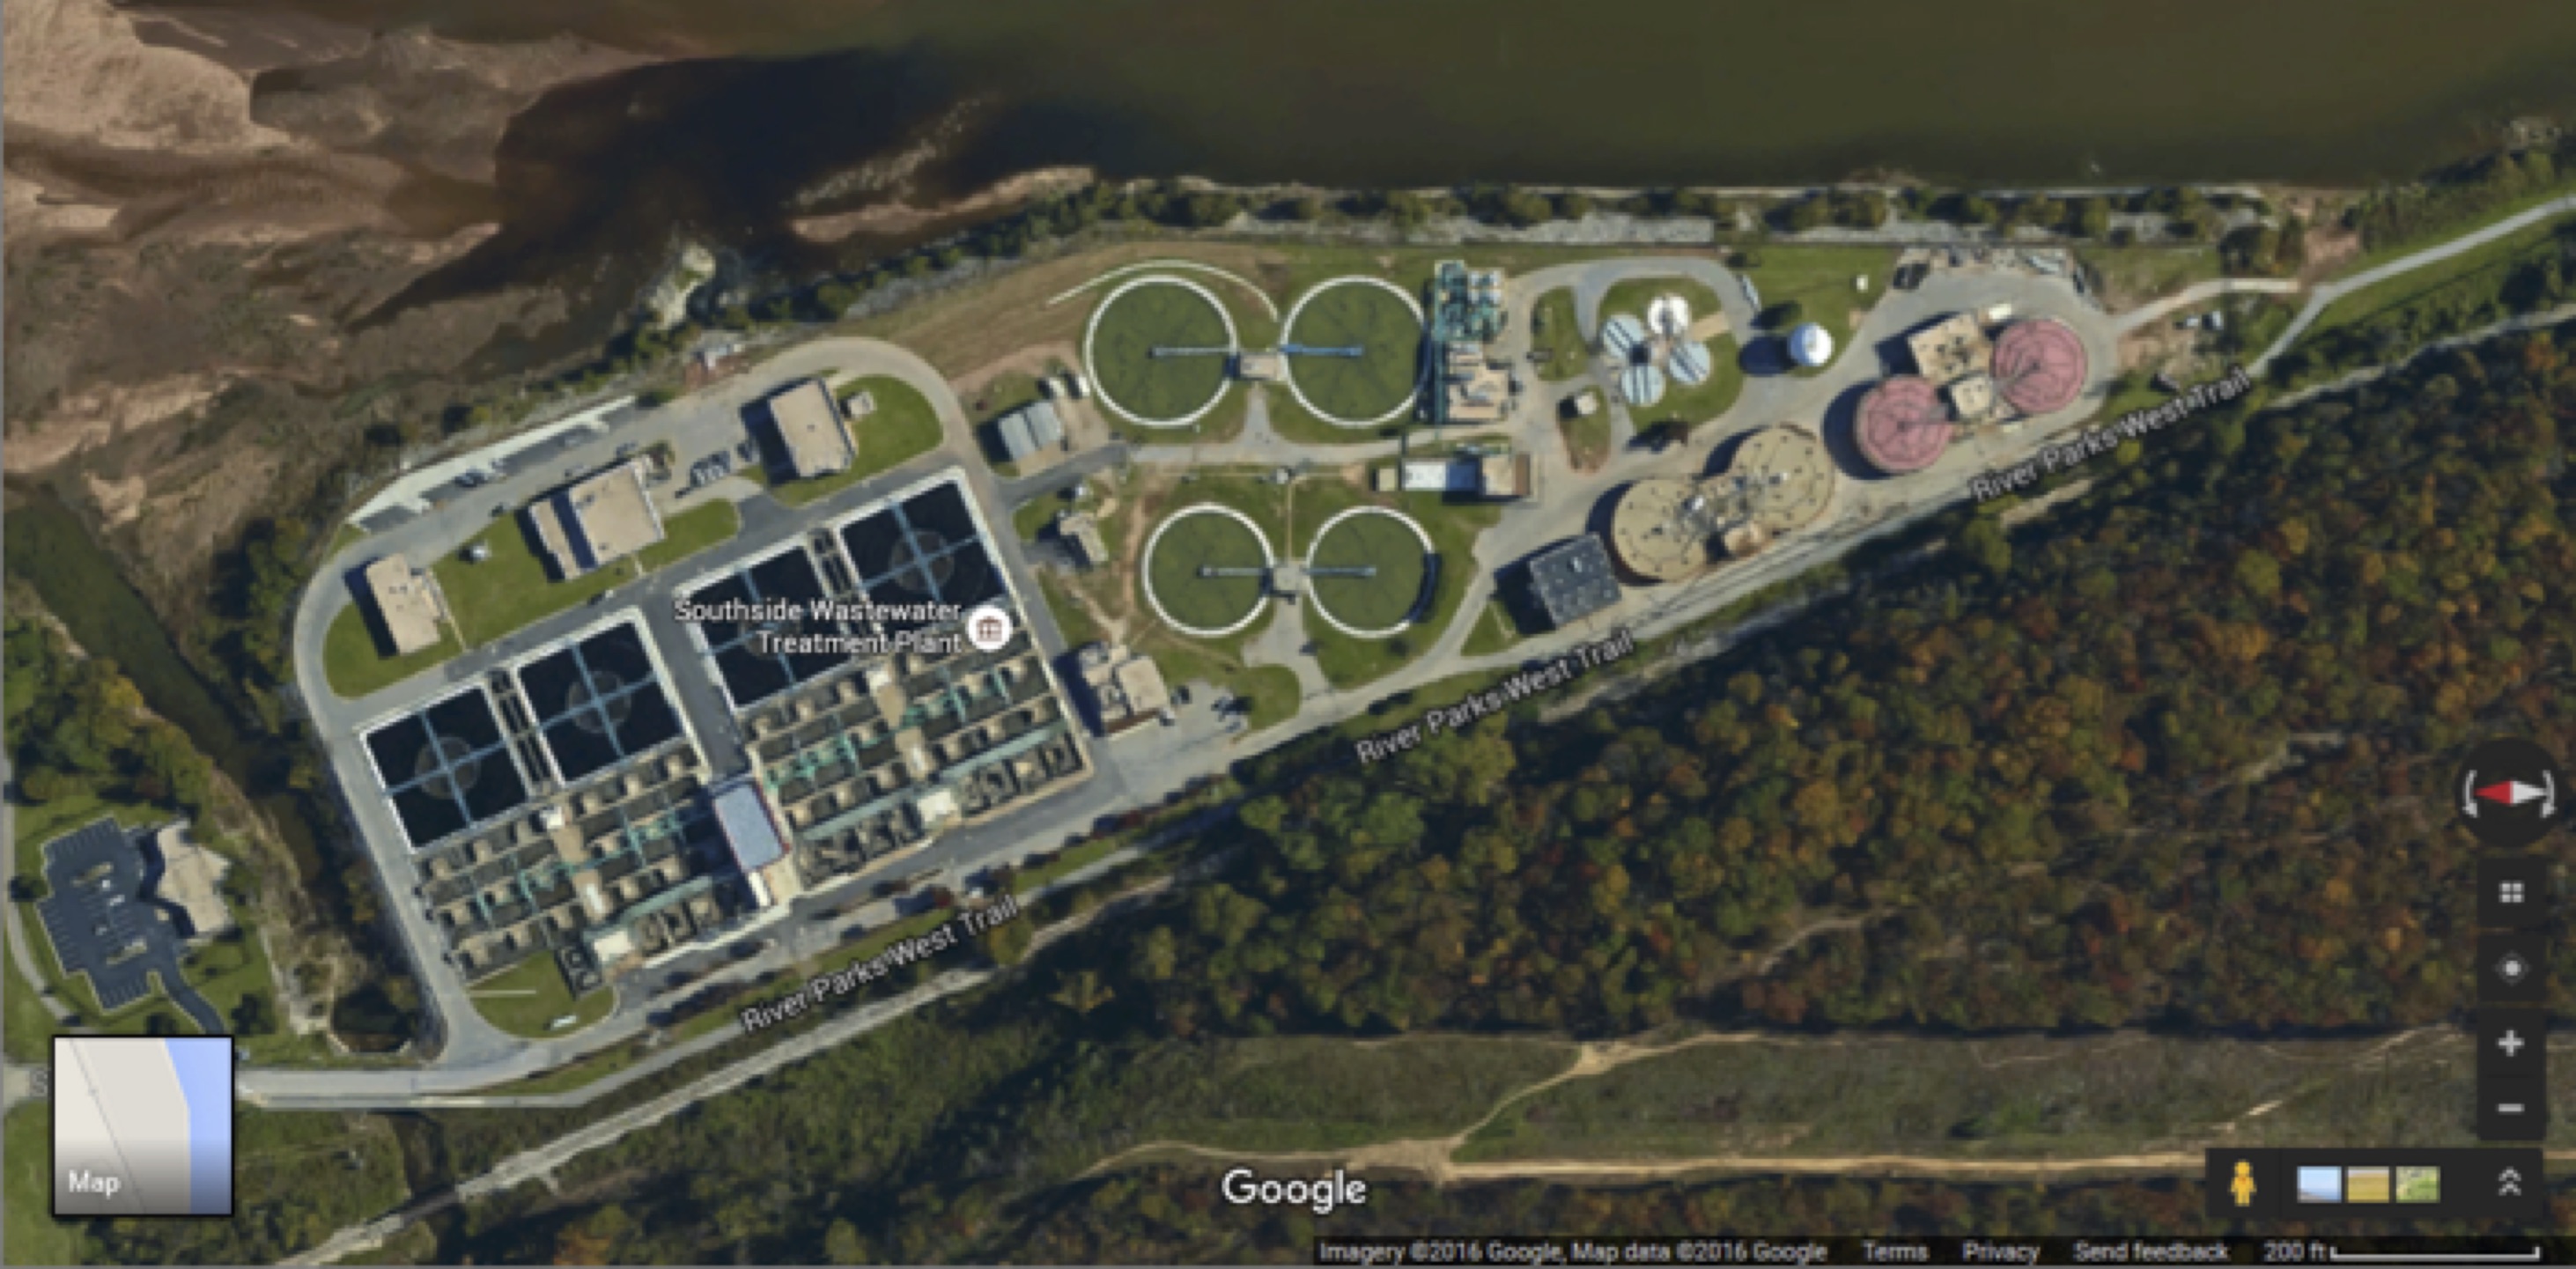
The hierarchy structure was first developed by using the largest and most complicated wastewater plant. In doing so as many assets and system grouped into a facility were captured and the potential organizational structure would take shape that would accommodate the most likely design elements of the other facilities. The Southside wastewater plant provided the template for the other wastewater plants, and the basis for developing the water plants.
The AB Jewel plant was the second plant that was developed, and being a water plant it would not have as many process systems as a wastewater plant. This meant that some systems were eliminated from the AB Jewel hierarchy since those systems did not exist there and were thus not populated with assets.
Soon thereafter the collection system of lift stations and rolling assets was addressed, which formed the basis for the raw water and finished water delivery facilities.
What is central to the eventual success of the CMMS, and any subsequent analysis, is the consistency of the hierarchy structure across all facilities, such that:
- all assets are at the same hierarchy level at any of the facilities, in this case level 7
- and all systems, such as pumping systems are at the same level across all facilities, in this case level 6
- all wastewater plants have the same organizational structure reflective of their typical unit processes
- all water plants have the same organizational structure reflective of their typical unit processes.
This facilitates familiarity between facilities and make finding assets much easier for maintenance staff, regardless of what plant they would be assigned to, as well as ensuring work orders were only written to assets, and not systems.
Criticality Analysis: The Next Step
The foundation of a meaningful and scalable asset management program that really focuses your limited resources is a criticality analysis at the system level. What makes the analysis meaningful is first aligning it with corporate values and aims. Without this alignment the analysis is a shot in the dark as to what’s really important, and all too often will miss the mark of where it is most critical to allocate resources, and thereby help assure success of both the program and the purpose for the facility.
All the assets in service by the facility are there to perform some function. Some of those functions are more important than others, but that relative importance is determined in part by the objectives of the organization or purpose of the facility, as well as the values the organization holds most important. Examples of this are safety, environmental compliance, regulatory compliance, possibly commercial terms or legal obligations, and even public relations. These are the parameters that the impacts of system failures will be measured against.
At the end of an analysis we are looking for a complete ranked order of the facility risk profiles as is shown below. These systems in ranked order of risk, and their contained assets, which then form the foundation of all that follows.
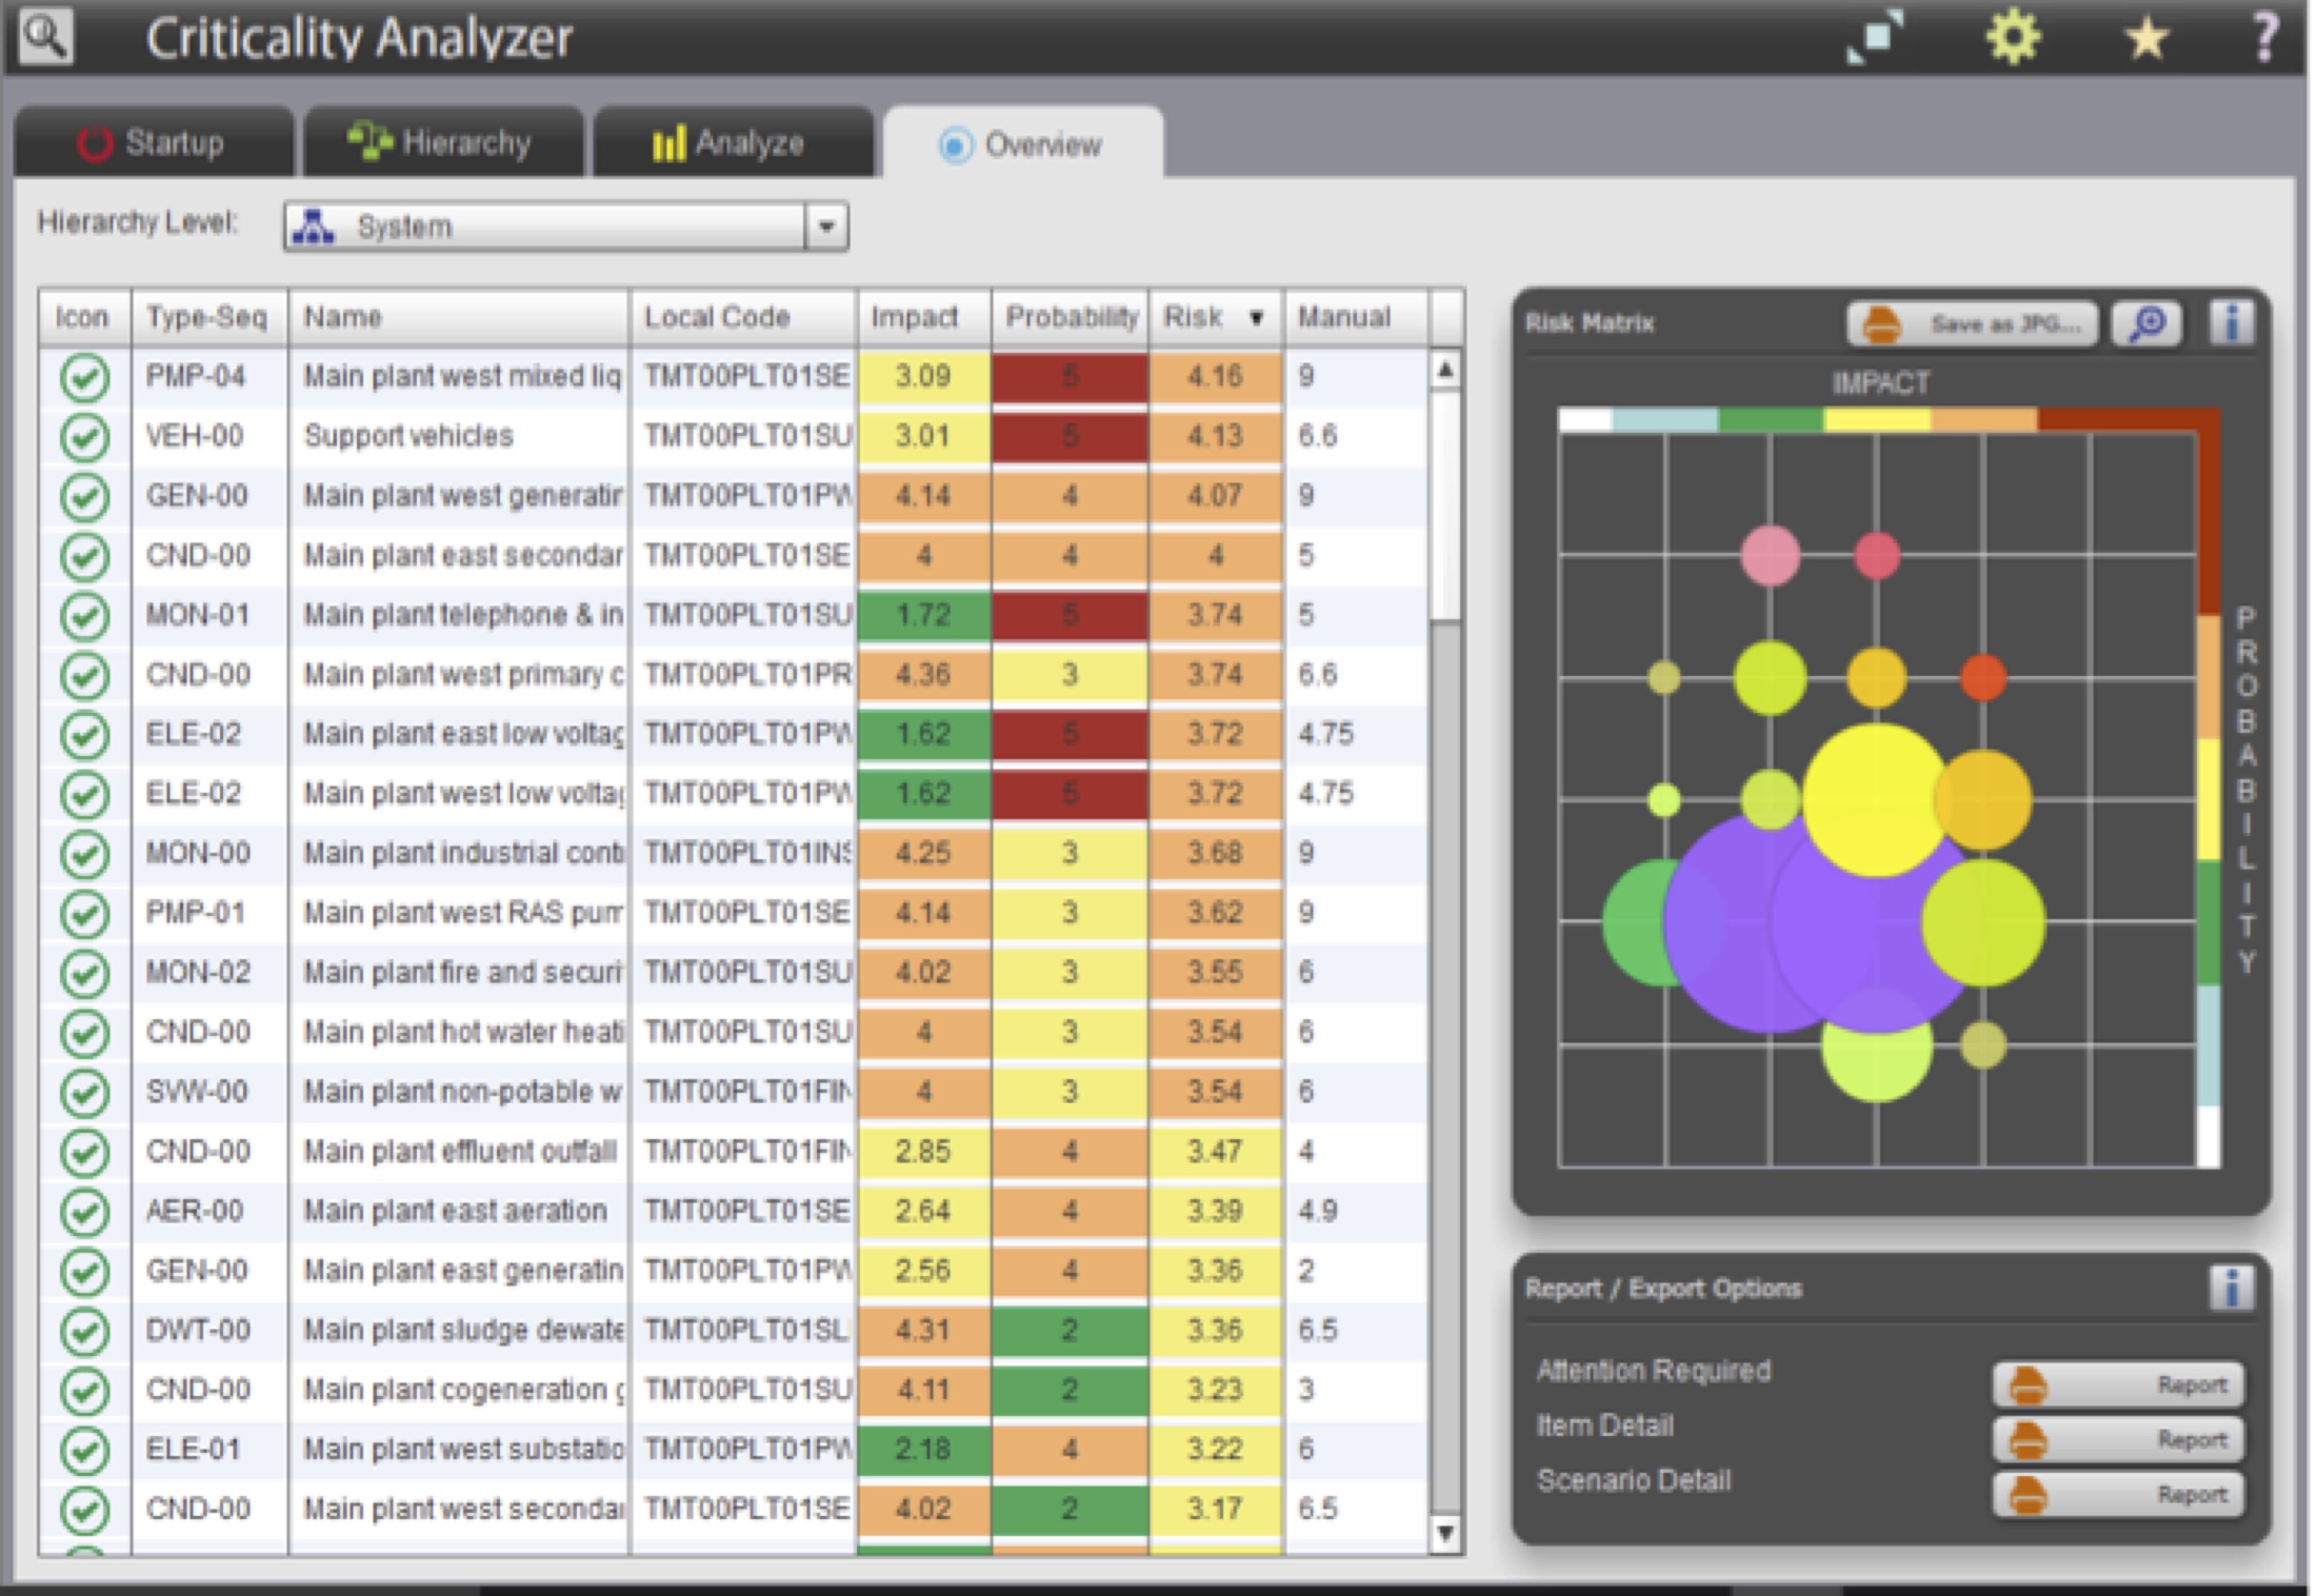
Risk Ranking and Facility Risk Profile View
More specifically, the reasons the criticality analysis is meaningful are at least three-fold:
- RCM should only be performed only on critical systems. The criticality analysis at the system level is designed to deliver that discrimination as all systems are then ranked in order of criticality, and if probability of occurrence is included, then of course the relative system risk to the whole is ranked.
- The important systems should be the first area where condition assessment and condition monitoring is applied, at the expense of relatively unimportant systems. Resources are always limited, and should be applied to the important systems first.
- The important systems should have the asset maintenance activities optimized, to address the asset failure modes, and thus prevent unscheduled and unexpected down time. Assets of negligible criticality can either be run to failure or different maintenance decision scan be made depending on the economics.
Summary
In the end, any asset management program should optimize the asset value to an organization, to deliver its intended function at the optimal economic value to the facility. To be able to do this, one MUST understand where to apply limited resources, hence understand what is critical to the operational success, and what is not so essential. The criticality analysis at the functional system level is the most efficient means of delivering this value, and it all starts with a well-structured hierarchy, organized by functional systems, with a comprehensive, complete, accurate asset register.
Comments are closed.